Serving Size vs Reference Amount on Canadian Labels
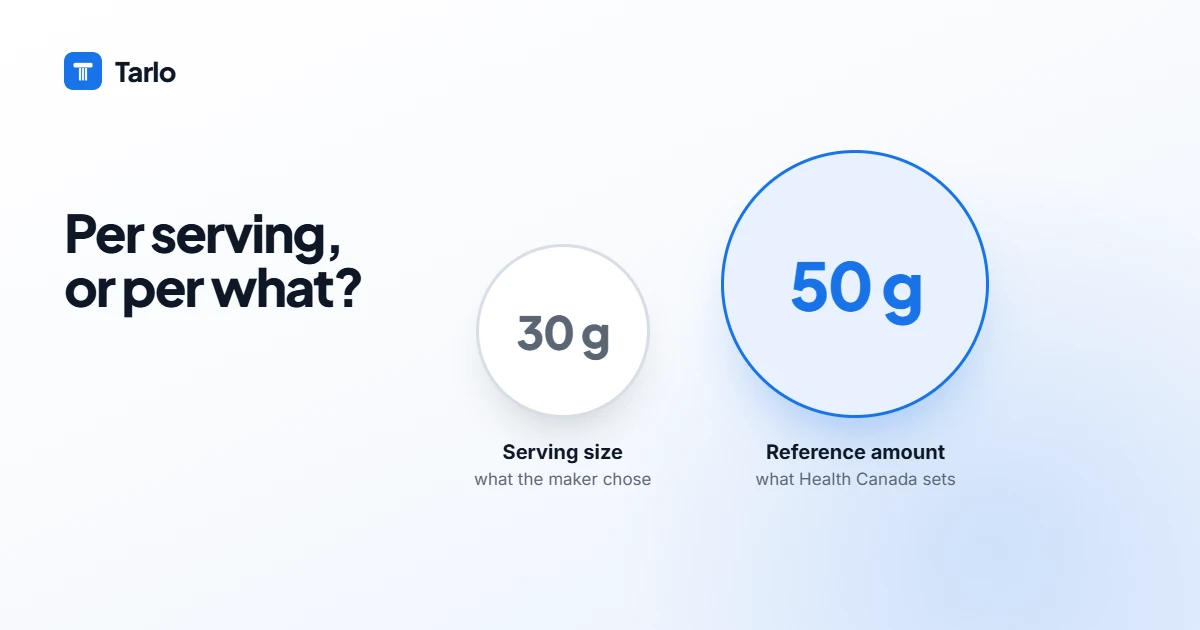
Two different “how much” concepts govern every Canadian food label, and almost nobody outside the industry knows both exist: the serving size printed on the Nutrition Facts table, and the reference amount Health Canada assigns behind the scenes. Confusing them is how a package can look modest while the front-of-package symbol says otherwise — and understanding the split takes five minutes. Here they are.
Why it matters to scanning: Tarlo computes nutrient verdicts per reference amount, not the printed serving — this article is the why.
Serving size: the printed one
The serving size heads every Nutrition Facts table — “Per 250 mL”, “Per 3 crackers (21 g)” — and every number below it (calories, sodium, sugars, %DV) describes that quantity. Canada’s label modernization pushed serving sizes toward regulated, comparable amounts based on what people typically eat, and requires household measures (crackers, mL) beside grams. Improvement, yes — but the serving size still has a structural weakness: it describes a portion, not necessarily your portion, and historically small-looking servings were the oldest trick for shrinking scary numbers.
Reference amount: the hidden one
The reference amount is Health Canada’s standardized quantity per food category — chips have one, soups have one, cookies have one — set out in regulation and not printed on the package. It exists to make rules apply evenly: when the front-of-package “high in” thresholds test a product, they test it per reference amount, the same quantity for every brand in the category. A manufacturer can print whatever compliant serving suits them; they cannot choose their reference amount. That’s the whole point.
A worked example
Take two cookie brands. Brand A prints “per 2 cookies (20 g)”: 6 g of sugars — looks moderate. Brand B prints “per 4 cookies (40 g)”: 12 g — looks worse. They’re the same cookie. Same recipe density, different printed portions. The reference amount for cookies (a small-RA category) tests both at the identical standardized quantity — so the FOP sugar symbol lands on both or neither, and the printed-serving optics stop mattering. This is also why Tarlo’s verdicts are computed from per-100 g data scaled to the reference amount: verdicts stay comparable across brands even when printed servings aren’t.
Why the split protects you
The two-number system is genuinely clever regulation: the serving size serves arithmetic (how much sodium is in what I’ll actually eat — multiply from the printed portion), while the reference amount serves judgment (is this product high in sodium as a category matter — immune to portion games). Products “eaten a little at a time” (pickles, condiments) get small reference amounts with a stricter 10% threshold; main dishes get big ones with a 30% bar. Categories, not marketing departments, set the yardstick — the same logic that makes the FOP symbol immune to shrinkflation.
Where each one shows up
Serving size: the Nutrition Facts table, recipe math, your own portion tracking. Reference amount: the FOP symbol decision, nutrient-content claims (“low in”, “source of” — all tested per reference amount and per serving), and scanner verdicts done properly. One practical habit: when comparing two products by their tables, check the serving grams first — equalize mentally (or per 100 g) before trusting the comparison. Or scan both and let the standardized math happen for you.
Frequently asked questions
Can manufacturers still game the serving size?
Much less than before — Canada’s modernization set regulated serving-size ranges per category. Residual wiggle exists within ranges; the reference amount is the backstop that ignores it entirely.
Where can I see the reference amounts?
Health Canada publishes the Table of Reference Amounts (Food and Drug Regulations, incorporated by reference) — it’s public but written for industry. Practically, you meet reference amounts through the FOP symbol and scan verdicts, not the table.
Why doesn’t Tarlo use the printed serving in crowdsourced data?
Because in open databases the serving field is crowd-entered and frequently wrong — while per-100 g values are reliable. Per-100 g × reference amount gives consistent verdicts; the methodology page documents it.
Is per-100 g comparison good enough on its own?
For like-for-like density comparisons, yes — it’s the honest equalizer. The FOP rules use reference amounts because eating patterns differ by category (100 g of soy sauce isn’t a thing); both beat raw printed servings.
Sources
- Health Canada — Nutrition labelling: serving sizes and the Table of Reference Amounts: canada.ca
- Canadian Food Inspection Agency — Nutrition Facts table requirements: inspection.canada.ca
Tarlo reflects the rules you turn on and is for general information only — it is not medical or dietary advice. Regulatory details are Canadian and current as of the date above; always verify the product's physical label.